Financial Highlights


Consolidated Management Performance
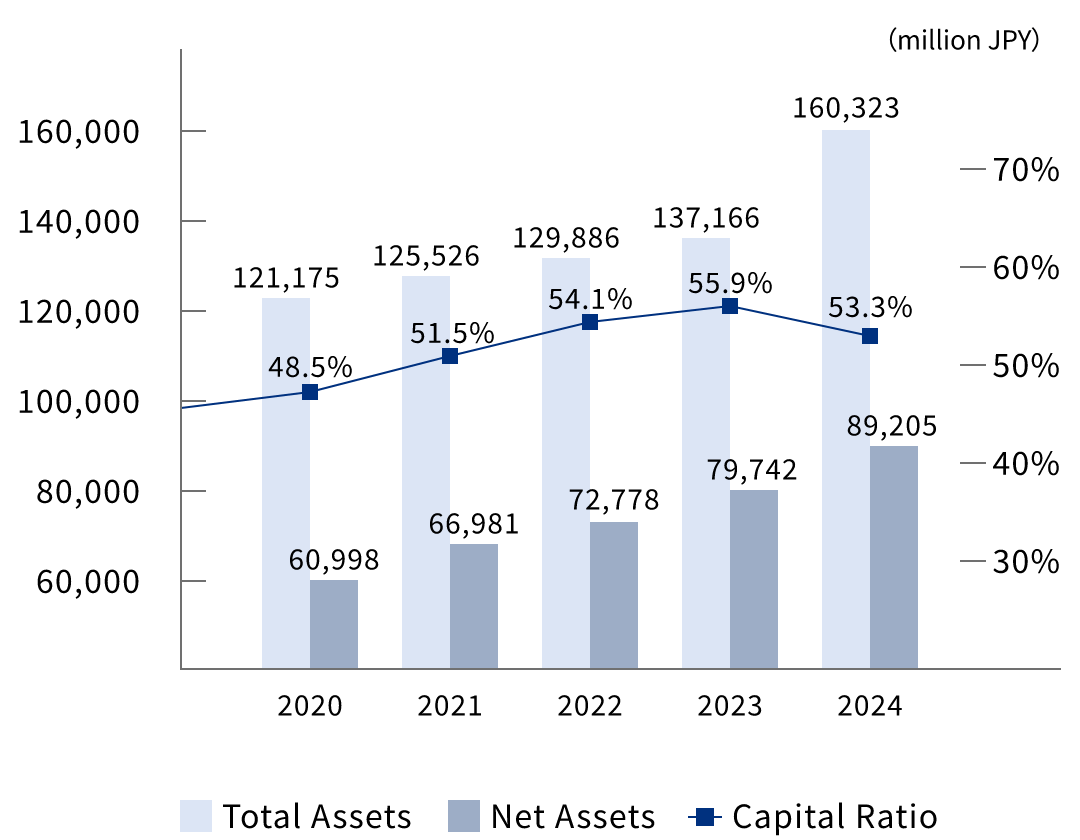
(million JPY)
(F.Y. from April 1 to March 31 in the following year.)
| 2021 | 2022 | 2023 | 2024 | 2025 | |
|---|---|---|---|---|---|
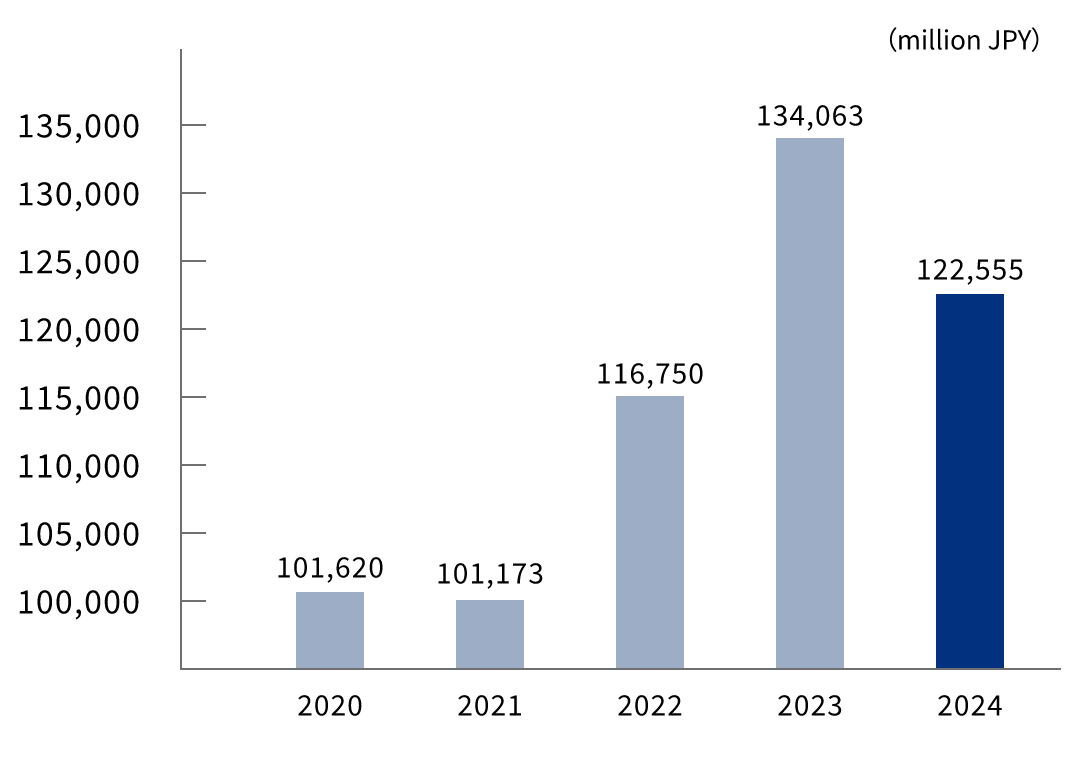
| Sales | 101,173 | 116,750 | 134,063 | 122,555 | 124,765 |
| Integrated logistics services |
100,179 | 115,525 | 132,134 | 120,539 | 122,710 |
| Others | 994 | 1,225 | 1,929 | 2,016 | 2,055 |
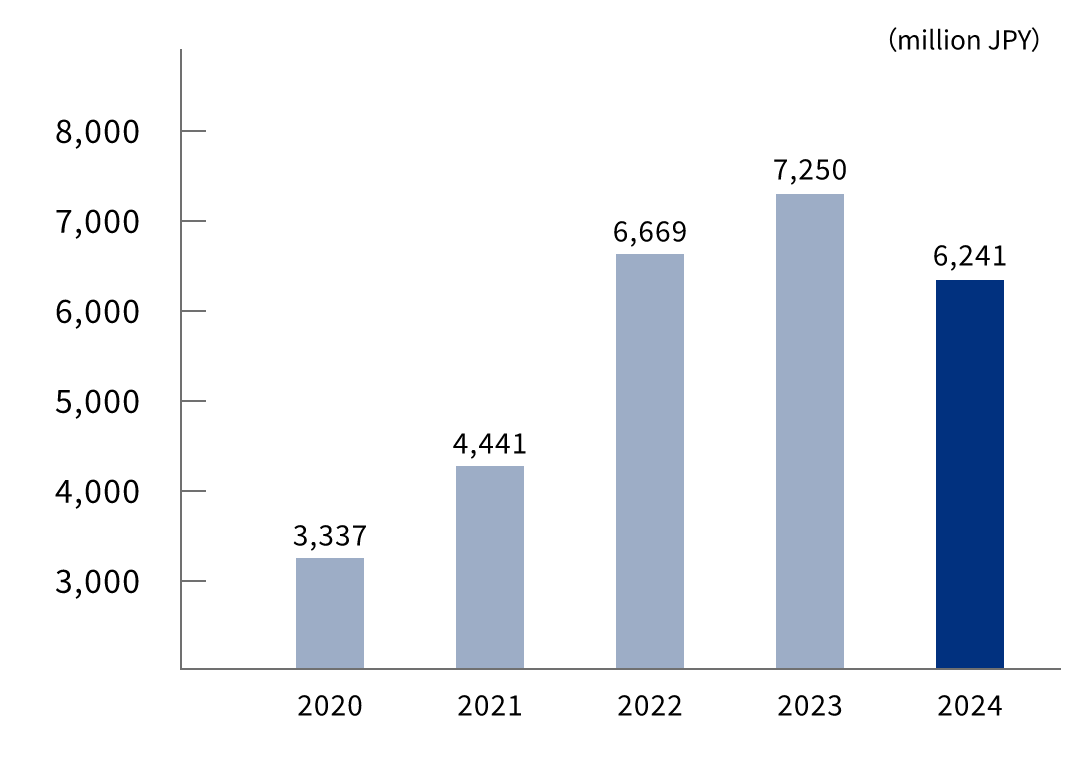
| Operating income | 4,441 | 6,669 | 7,250 | 6,241 | 7,805 |
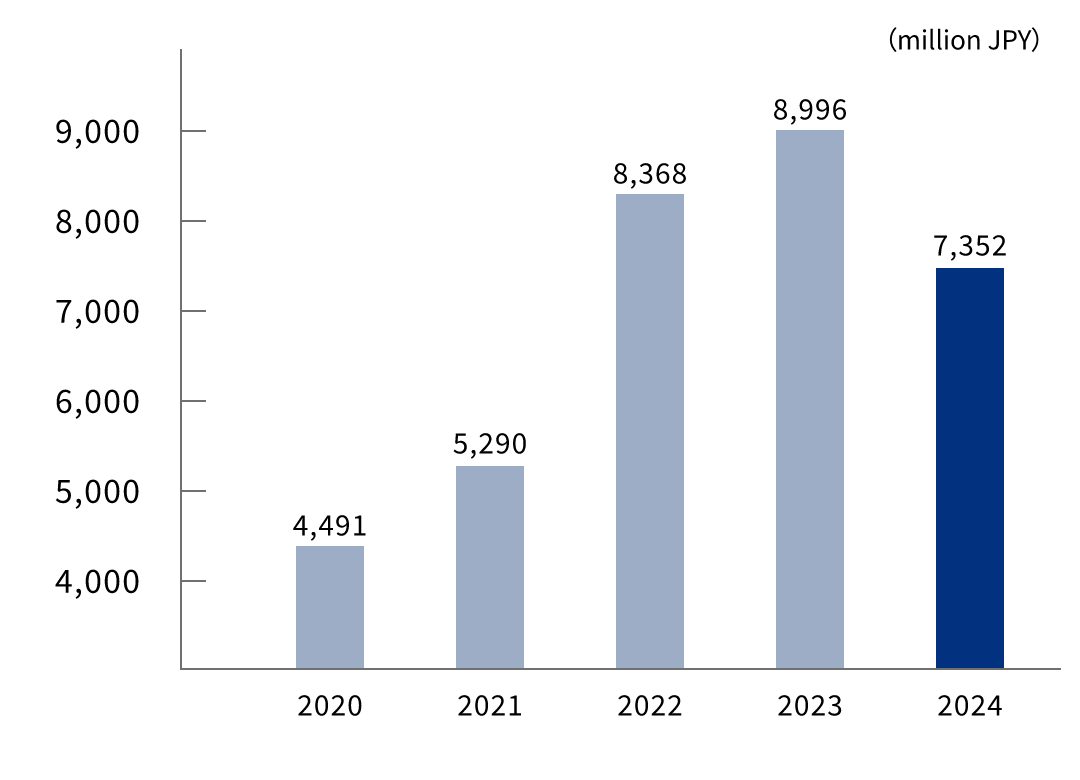
| Ordinary profit | 5,290 | 8,368 | 8,996 | 7,352 | 8,806 |
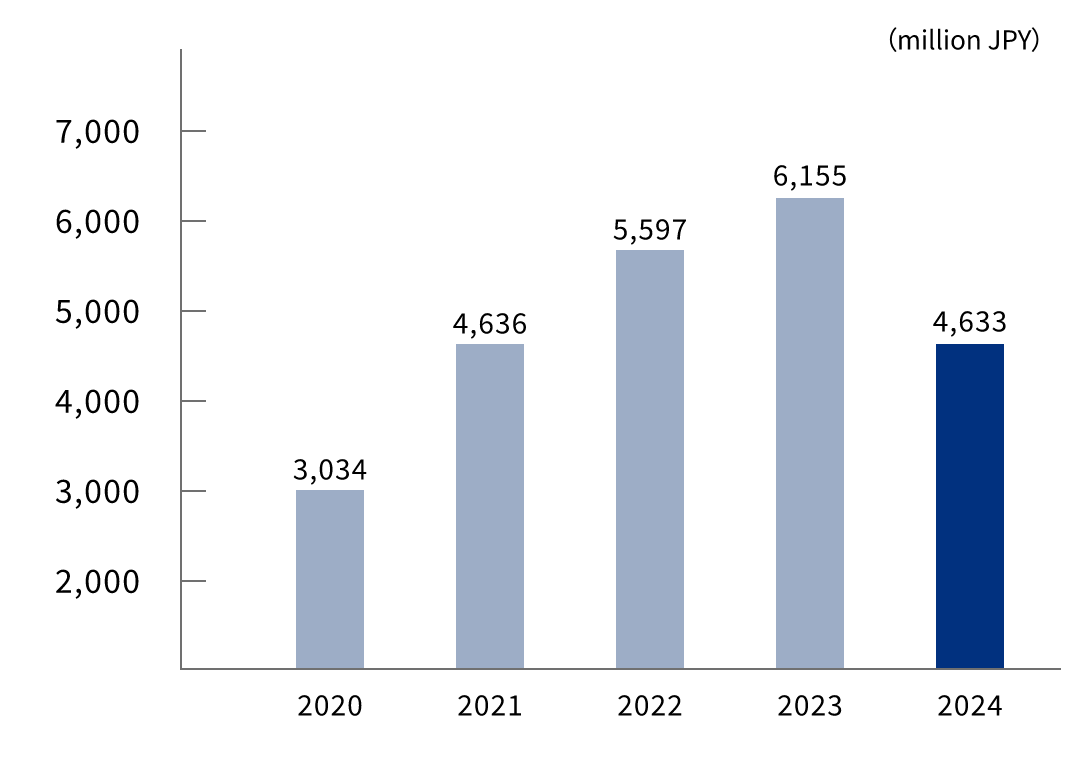
| Net profit | 4,636 | 5,597 | 6,157 | 4,633 | 6,041 |
| Earnings per share(EPS) |
72.29yen | 87.14yen | 95.76yen | 72.53yen | 95.75yen |
| Total assets | 125,526 | 129,886 | 137,165 | 160,323 | 165,411 |
| Net assets | 66,981 | 72,778 | 79,740 | 89,205 | 95,574 |
| Capital ratio | 51.5% | 54.1% | 55.9% | 53.3% | 55.1% |
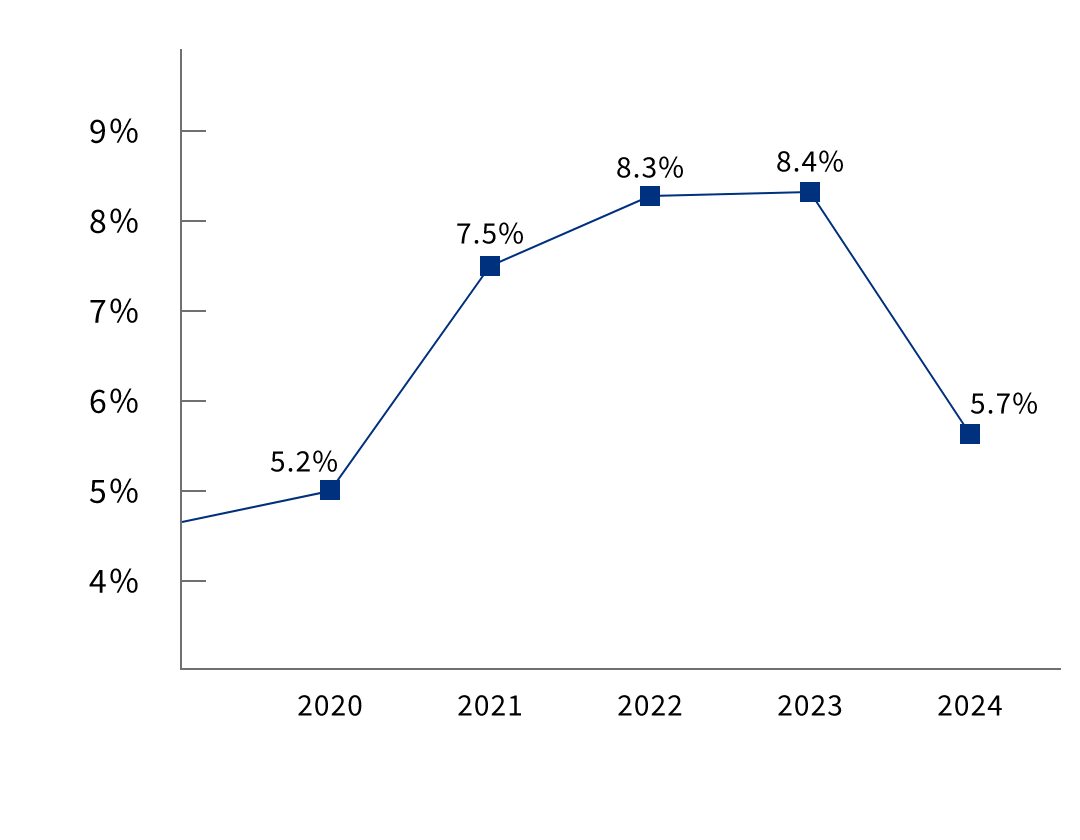
| Return on equity (ROE) |
7.5% | 8.3% | 8.4% | 5.7% | 6.8% |
Sales
Operating Income
Ordinary Profit
Net Income
Total Assets, Net Assets, Capital Ratio
Return on Equity (ROE)
Download Financial Statement
Download our past 10-year Financial Statement (.xls)